9 The future of predictive soil mapping
Edited by: R. A. MacMillan and T. Hengl
9.1 Introduction
This chapter presents some opinions and speculation about how predictive soil mapping (PSM) may evolve, develop and improve in the near term future. These thoughts were originally prepared for a discussion document about whether national to provincial scale soil inventory programs in Canada could, or indeed should, be reinvented and reinvigorated and, if so, how this reinvention might be best designed and accomplished.
The solutions proposed for reinvigorating presently moribund soil inventory programs in Canada were largely based on adopting new methods and ideas associated with PSM within a new collaborative, collective and open operational framework. These earlier thoughts were considered to be relevant to the more general topic of the future of predictive soil mapping (PSM). As such, the original discussion document was slightly modified, extended and included as a chapter in this book.
This chapter addresses the following two main issues:
What caused past national to state level conventional soil, and other terrestrial resource, inventory programs to anthropy and disappear globally and can they now be renewed and resurrected?
How can the methods and ideas behind PSM be adopted and applied to accomplish the goal of renewing and reviving conventional soil and terrestrial resource inventory programs?
9.2 Past conventional terrestrial resource inventories
9.2.1 Why have most national resource inventories been discontinued?
Historically, almost all past terrestrial resource inventory agencies were slow, expensive to maintain and failed to produce complete, consistent, current and correct map coverage (4Cs) for entire areas of political jurisdiction or interest. Most national agencies were unable to completely map an entire administrative area affordably at any useful scale using a single consistent methodology applied over a relatively short time span to produce a single wall to wall map product. Instead almost all past inventory efforts have been piecemeal and incomplete.
This resulted in what we consider to be “the embarrassment of the index map”. Virtually every jurisdiction produced an index map to illustrate which parts of the jurisdiction had been mapped at all, which different mapping methods were used to map different parts, which eras or years each bit of mapping represented and what scale of mapping had been carried out in any part. This index map was often proudly displayed and circulated to illustrate how much progress had been made towards mapping an entire jurisdiction of interest. In actual fact, the index map represented a powerful demonstration of all that was wrong with mapping and mapping progress in that jurisdiction.
The first thing that index maps clearly demonstrated was that there was no complete map coverage for the area at any scale. The second thing highlighted was that there was no consistency in scale, methods or legend across even areas that had been mapped. Different areas had been mapped at different scales, over different times, using different concepts and legends and no effort had been expended to achieve consistency across the entire area. The third thing that would also become immediately obvious was that, at current rates, complete mapping of any jurisdiction would never be achieved in anyone’s lifetime. Not particularly encouraging information to impart. And yet, every agency maintained an index map and loved to share it.
Another significant historical misjudgement was the failure to make the information and services provided by terrestrial inventory service agencies critically important and absolutely necessary to at least one essential decision making process, preferably a legally mandated one. Where inventory agencies still survive, they have linked their products and services intimately to one or more clearly defined, and legally mandated, decision making processes that involve the expenditure of considerable sums of (usually public) money. Soil survey survives in the USA (at least for now) largely because county scale soil maps are a critical requirement for calculating eligibility for financial support payments for many agricultural subsidy and support payment programs. You cannot apply for, or obtain, a subsidy payment unless you have a soil survey map to justify your eligibility for the payment and to document where and how the required supported activity will be implemented.
It can be argued that many terrestrial resource inventory programs failed (and disappeared) because they viewed themselves as their own primary customer and designed and delivered products and services meant to satisfy their own desires and expectations and not those of real, downstream users. They became convinced of the rightness, value and importance of their maps and databases the way they wanted to make them and did not effectively listen to, or respond to, criticism of these products. Users would criticize conventional soil polygon maps and reports filled with complicated jargon and impenetrable legends and be dismissed as simply not being able to understand a soil map and to appreciate how complicated and complex it was to portray the spatial variation in soils in a simple way. Rather than trying to design and make simpler representations of more easily understood spatial patterns, terrestrial inventory agencies would suggest that an expert in making the maps was required to assist users in interpretation and use of any map.
9.2.2 Is there a future for conventional terrestrial inventory programs?
We have asked ourselves, “can conventional comprehensive soil and similar terrestrial inventory programs be saved or renewed?” The short answer is: probably no, at least not in their present format. Conventional resource inventory programs have become too expensive, too slow to deliver needed outputs and too slow to change to produce innovative and needed products. There is now probably insufficient will, money, demand or benefit to support continuation, or re-establishment, of conventional, government-funded, comprehensive inventory programs as we have known them in the past. However, that does not mean that all needs and benefits previously provided by comprehensive inventory programs are being met now or that they do not need to be met. There are a large number of benefits associated with the existence of comprehensive inventories and we ask if these may not be important to continue to service and if they might still be provided under some newly redesigned framework.
9.2.3 Can terrestrial inventory programs be renewed and revived?
One of our key hopes (which we especially try to achieve through the OpenGeoHub Foundation), is to contribute to a discussion of how comprehensive terrestrial resource inventory programs (or equivalent frameworks) might be re-imagined, re-designed, re-invented, re-implemented and renewed at regional to national to global scales, for the next generation, and by whom.
We consider here that we are now at a nexus where it has become possible to address and redress many of the past inconsistencies and oversights in terrestrial resource mapping. It is now completely feasible to aspire to affordably and expeditiously produce new predictive maps that achieve the 4 Cs and are:
Complete (e.g. cover entire areas of interest),
Consistent (e.g. are made using a single methodology, applied at a single scale and over a single short period of time),
Current (e.g. represent conditions as they are today, at a specific moment in time),
Correct (e.g. are as accurate as is possible to achieve given available data and methods),
We consider that it is also now possible to redesign any new output maps so that they are capable of acting directly as inputs to well established processes and programs for planning and decision making at national to regional to operational scales. And we consider that we have a unique opportunity to work collaboratively with numerous actual and potential users of spatial inventory data to ensure that new output products directly meet their spatial data needs.
9.2.4 How can terrestrial inventory programs be renewed and revived and by whom?
In light of developments in science, technology, methods of societal interaction and new models of funding and cooperative action, we suggest that looking back at how things were done in the past no longer provides the most appropriate model for how inventory activities ought to be designed and conducted in the future. We argue that it is preferable to re-imagine an entirely new framework for cooperation, which takes advantage of new scientific and organizational advances and within which many of the acknowledged benefits of previous, government-funded, programs can be delivered within a new model of cooperative, collective action and sharing.
In this age of Facebook and Twitter and Wikipedia and Google Earth, it is no longer the purview, or responsibility, of any single, government funded, agency to collect, produce, maintain and distribute comprehensive information about the spatial distribution of soils, eco-systems, terrain units, wetlands or any other terrestrial attributes. We believe that it should instead become a collective responsibility, for a large variety of overlapping groups and institutions, to create, maintain and share spatial information of common interest. It is incumbent on these diverse interest groups to identify mechanisms by which willing collaborators can join together to produce, maintain and distribute basic levels of spatially distributed land resource information jointly and collectively.
9.3 The future of PSM: Embracing scientific and technical advances
9.3.1 Overview
We consider that any new, future collaborative PSM activity should take advantage of recent scientific and technical advances in the following areas:
Collection of field observations and samples:
Collating and harmonizing existing legacy soils data,
New field sampling designs and programs and new data collection strategies,
Characterization of soils in the field and in the laboratory:
New field sensors for characterizing soils in situ,
New faster, cheaper and more accurate methods of laboratory analysis,
Creation, collation and distribution of comprehensive sets of environmental covariates:
Introduce new covariate data sets based on new remote, air and space sensors,
Include new varieties and resolutions of DEM and other environmental covariate data,
Maximize use and relevance of existing data sets of environmental covariates,
Automated spatial prediction models:
Replace previous qualitative and subjective mental models with new quantitative and objective statistical models,
Adopt new methods of automated space-time modelling and prediction,
New options for hosting, publishing, sharing and using spatial data via cloud services:
Develop new platforms for collaborative data sharing and geo-publishing,
Develop open services to deliver on-demand, real time online mapping,
9.3.2 Collection of field observations and samples
We can improve how we locate and obtain data on field observations and measurements. These O&M field data provide the evidence that is essential for developing all spatial prediction models and outputs. First consider the challenges and opportunities associated with identifying, obtaining and using existing, or legacy, field observations and measurements.
Legacy field data refers to any field observations or measurements that were collected in the past and that remain discoverable and available for present use. Typically, these legacy field data consist of either field observations and classifications made at point locations to support the development of conventional, manually prepared maps or of laboratory analysed samples, collected to support characterization of point locations considered to be typical or representative of a particular soil class or individual. Legacy field data may already be in digital format and stored in digital databases. More often, legacy data are found in paper reports, manuals, scientific publications and other hard copy formats that require the data to first be transformed into digital format and then harmonized into a standardized format before they can be used effectively.
Legacy field data typically possess several characteristics which can make their use for producing new inventory map products problematic. Some common limitations of legacy field data are:
They are rarely collected using any kind of rigorous, statistically valid, sampling design,
Their locations in space (geolocations) are often not measured or reported accurately,
Their locations in time (sampling dates) are often unknown or are spread over decades,
The methods used in description or analysis can vary greatly by source, location or time,
They can be difficult and costly to find, to obtain, to digitize and to harmonize,
Despite these limitations, legacy field data have other attributes that make them valuable and worth assembling, collating, harmonizing and using. The advantages associated with using legacy field data can be summarized as follows:
Legacy point data provide the only source of baseline information about past time periods:
We can’t go back in time to collect new samples or make new observations applicable to past time periods,
They establish prior probabilities which are essentially starting points that describe what we know now before we start making new predictions and new maps using new data,
Legacy point data are all we have initially to work with until new field data can be obtained:
Use of legacy field data can help us to learn and to improve methods and approaches,
Working through the full cycle required to produce predictive maps using legacy data lets us learn a lot about how to do it and, more importantly, how we might do it better the next time around,
They give us something to work with to provide real-world, worked examples, for ourselves and for potential users, of the kinds of maps and other products that can now be produced using modern automated prediction methods,
Legacy point data help us to illustrate problems, weaknesses and opportunities for improvement:
Gaps in existing legacy data (missing data in space and time) help to illustrate the need to have samples that comprehensively cover all areas of space and time of interest,
Errors and uncertainties in initial predictive maps based on legacy field data provide a clear illustration of the need for more and better field data to improve future mapping,
The spatial distribution of uncertainties computed for initial maps created using legacy data can identify locations where new observations and samples are most needed and will contribute most to improving subsequent predictions,
Legacy point data can be surprisingly difficult and costly to find, obtain, harmonize and digitize (Arrouays et al. 2017). One can only imagine how many hundreds of thousands, even millions, of site observations may have been made by field personnel undertaking many different types of inventories for many different agencies over the years. Similarly, laboratories have definitely analyzed millions of soil samples over the years for samples collected by government agencies, private sector consulting companies, NGOs, advocacy groups, farmers or landowners. Unfortunately, very few of these observations or samples have survived to enter the public domain where they can now be easily located and obtained.
In an ideal world, it would be possible to identify and obtain hundreds of thousands to perhaps even millions of laboratory analysed results for point locations globally. These samples surely were taken and analysed but they no longer remain accessible. Instead, best efforts to date have resulted in rescuing some 300,000 to 350,000 records globally for which soil analytical data exist for geolocated point locations. What has happened to all of the thousands to millions of other analysed samples that were undeniably collected and analysed? Essentially they may be considered to be lost in the mists of time, victims of lack of will and lack of resources to support maintaining a viable archive of observation and sample results over the years. Unfortunately, no entity or agency had the mandate to maintain such a comprehensive global archive and no one had the vision or resources to take on such a challenge.
The world can do a much better job of locating, harmonizing, archiving and sharing global legacy field and laboratory data than it has done to date (Arrouays et al. 2017). It is incumbent on agencies, companies, organizations and individuals that hold, or are aware of, collections of legacy field data to step forward to offer to contribute such data to a comprehensive and open repository of field observations and laboratory measurements. We would hope that the evidence of beneficial use of legacy point data by OpenGeoHub to produce concrete examples of needed and useful spatial outputs would encourage entities that hold field O&M data that are not currently publicly available to contribute them for future use by a community of global mappers. Techniques developed by OpenGeoHub to collate and harmonize legacy point data could be applied to any new, previously overlooked, data sets contributed, in the future, by interested parties.
9.3.3 Collecting new field O&M data
The Africa Soil Information Service (AfSIS) project (http://www.africasoils.net) provides a powerful example of how new field observations and laboratory analysed field data can be collected in a manner that is reliable, feasible and affordable. AfSIS is one of the very few global examples of an entity that has not accepted that collection of new field data is too difficult and too expensive to contemplate. Instead, AfSIS asked the question “how can we make it feasible and affordable to collect new, high quality, field data?” And then AfSIS (and several partner countries) went ahead and collected new field data using modern, robust and affordable methods of field sampling and laboratory analysis.
Following the example of AfSIS, we can identify the following major considerations for how the collection of new field O&M data can be made both more affordable and more effective.
Select locations for field sampling using a formal, rigorous sampling design (J. Brown, Robertson, and McDonald 2015; Stumpf et al. 2017; Brus 2019),
Design based sampling schemes:
Random sampling,
Stratified random sampling,
Systematic sampling (confluence point or grid sampling),
Nested, multi-scale hierarchical sampling,
Spatially-based sampling,
Model based sampling schemes:
Conditioned Latin Hypercube (cLHC) sampling (Malone, Minansy, and Brungard 2019),
Multi-stage sampling at locations of maximum uncertainty,
Systematize and automate all field sampling and recording procedures as much as possible,
Create custom tools and apps to support:
Locating sample sites and recording observations,
Assigning unique identifier sample numbers to all locations and samples,
Tracking progress of samples from the field through the lab to the database,
Adopting formal sampling designs to identify where to best collect new field O&M samples offers several significant advantages.
Firstly, statistically valid sampling schemes ensure that the fewest number of samples are required to achieve the most correct and representative values to characterize any area of interest. This minimizes field data collection costs while maximizing usefulness of the samples. Secondly, there is rapidly growing interest in, and need for, measuring and monitoring of changes in environmental conditions through time (e.g. carbon sequestration or losses, fertility changes). Quantitative statements can only be made about the accuracy of changes in values for any given area if there is an ability to replicate those values with a subsequent comparable sampling effort. The ability to return to any given area at some later time to collect a second set of statistically representative field samples is essential to any effort to quantify and monitor changes through time. Only statistically based sampling frameworks support repeat sampling.
Design based sampling schemes generally require little to no advance knowledge about the patterns of spatial variation within an area to be sampled. They are best used for situations where there is little existing knowledge about spatial variation and where there is a need to collect a representative sample with the fewest possible sample points.
Of the design based options available a nested, multiscale sampling design based on a stratified random sample framework or spatially-based sampling appears as a suitable option. In these nested sampling approaches, explicit attention is given to ensuring that multiple samples are collected at a succession of point locations with increasingly large interpoint separation distances (e.g. 1 m, 10 m, 100 m, 1 km). These multiple points support construction of semi-variograms that quantify the amounts of variation in any attribute that occur across different distances. Knowing how much of the total observed variation occurs across different distances can be very helpful for identifying and selecting the most appropriate grid resolution(s) to use for predictive mapping. If 100% of the observed variation occurs over distances shorter than the minimum feasible grid resolution, then there is really no point in trying to map the attribute spatially at that resolution. Similarly, if most of the observed variation occurs across longer distances, there is really little point in using a very fine resolution grid for prediction. Most past purposive sampling undertaken for conventional inventories was not particularly well suited to supporting geostatistics and the production of semi-variograms.
Model based sampling frameworks are recommended for situations where there is some existing (a-priori) knowledge about the spatial pattern of distribution of properties or classes of interest. Conditioned Latin Hypercube (cLHC) sampling is based on first identifying all significant combinations of environmental conditions that occur in an area based on overlay and intersection of grid maps that depict the spatial distribution of environmental covariates (Stumpf et al. 2016; Malone, Minansy, and Brungard 2019). Potential point sample locations are then identified and selected in such a way that they represent all significant combinations of environmental conditions in an area. Point samples are typically selected so that the numbers of samples taken are more or less proportional to the frequency of occurrence of each significant combination of environmental covariates. This ensures that samples cover the full range of combinations of environmental conditions (e.g. the covariate space) in an area and sample numbers are proportional to the relative extent of each major combination of environmental conditions in an area.
Field sampling programs can also be designed to collect new point samples at locations of maximum uncertainty or error in a current set of spatial predictions (Stumpf et al. 2017). The spatially located measures of uncertainty computed as one output of a prediction model can be used to provide an indication of the locations where it may be most beneficial to collect new samples to reduce uncertainty to the maximum extent possible. This type of sampling approach can proceed sequentially, with predictions updated for both estimated values and computed uncertainty at all locations after any new point sample data have been included in a new model run. It is often not efficient to collect just one new point sample prior to rerunning a model and updating all predictions of values and uncertainties. So, it is often recommended to collect a series of new point observations at a number of locations that exhibit the largest estimates of uncertainty and then update all predictions based on this series of new field point data. Collecting a series of new multistage samples can be repeated as many times as is deemed necessary to achieve some specified maximum acceptable level of uncertainty everywhere.
Field sampling can also be made more efficient, and less expensive, by creating and adopting more systematic and automated procedures to support field description and sampling. Custom apps can be developed to help to choose, and then locate, sampling points in the field rapidly and accurately. These field apps can be extended to automate and systematize most aspects of making and recording observations in the field, thereby increasing speed and accuracy and reducing costs. Unique sample numbers can be generated to automatically assign unique and persistent identifiers to every site and to every soil sample collected in the field. This can reduce costs and errors associated with assigning different sample IDs at different stages in a sampling campaign ( e.g. field, lab, data entry). Persistent and unique machine readable identifiers can help to support continuous, real-time tracking of the progress of field descriptions and soil samples from initial collection in the field through laboratory analysis to final collation in a soil information system. This consistency and reliability of tracking can also improve efficiency, decrease errors and reduce costs for field description and laboratory analysis. Taken all together, improvements that automate and systematize field descriptions and field sampling can make it much more affordable and feasible to collect new field data through new field sampling programs.
Brus (2019) provides a systematic overview of sampling techniques and how to implement them in R. The author also recongizes that “further research is recommended on sampling designs for mapping with machine learning techniques, designs that are robust against deviations of modeling assumptions”.
9.3.4 Characterization of soils in the field and the laboratory
Characterization of field profiles and samples can be made more affordable and feasible again by making maximum use of new technologies that enable field descriptions and laboratory analyses to be completed more rapidly, more affordably and more accurately.
Field characterizations can be improved by making use of a number of new technologies. Simply taking geotagged digital photos of soil profiles and sample sites can provide effective information that is located with accuracy in both space and time. New sensors based on handheld spectrophotometers are just beginning to become available. These may soon support fast, efficient and accurate characterization of many soil physical and chemical attributes directly in the field. Other field instruments such as ground penetrating radar (Gerber et al. 2010), electrical conductivity and gamma ray spectroscopy (Rouze, Morgan, and McBratney 2017) are also becoming increasingly available and useful. Field sensors for monitoring soil moisture and soil temperature in real time and transmitting these data to a central location are also becoming increasingly common and affordable to deploy. Portable MIR scanners achieve almost the same accuracy as laboratories (Hutengs et al. 2018). Simple field description protocols based on using mobile phones to crowdsource a set of basic observations and measurements could enable massive public participation in collecting new field data.
Recent developments in the use of new, rapid and accurate pharmaceutical grade analytical devices have reduced the costs of typical laboratory analyses dramatically, while, at the same time, significantly improving on reproducibility and accuracy (Shepherd and Walsh 2002, 2007). A modern soil laboratory now entails making use of mid and near infrared spectrophotometers, X-ray diffraction and X-Ray diffusion and laser based particle size analysis. Using these new instruments, it has been demonstrated that total costs for running a complete set of common soil analyses on a full soil profile can be reduced from a current cost of US$ 2,000 to as little as US$ 2–10 per profile (Shepherd and Walsh 2007; Rossel et al. 2016). This reduction in cost, along with the associated improvement in reproducibility is a game changer. It makes it, once again, feasible and affordable to consider taking new field soil samples and analyzing them in the laboratory.
9.3.5 Creation, collation and distribution of effective environmental covariates
Any future soil inventory activities will inevitably be largely based on development and application of automated predictive soil mapping (PSM) methods. These methods are themselves based on developing statistical relationships between environmental conditions that have been mapped extensively, over an entire area of interest (e.g. environmental covariates), and geolocated point observations that provide objective evidence about the properties or classes of soils (or any other environmental attribute of interest) at specific sampled locations.
The quality of outputs generated by predictive mapping models is therefore highly dependent on the quality of the point evidence and also on the environmental covariates available for use in any model. For environmental covariates to be considered effective and useful, they must capture and describe spatial variation in the most influential environmental conditions accurately and at the appropriate level of spatial resolution (detail) and spatial abstraction (generalization). They must also describe those specific environmental conditions that exhibit the most direct influence on the development and distribution of soils or soil properties (or of whatever else one wishes to predict). The degree to which available environmental covariates can act as reliable and accurate proxies for the main (scorpan) soil forming factors has a profound influence on the success of PSM methods. If available covariates describe the environment comprehensively, accurately and correctly, it is likely that predictive models will also achieve high levels of prediction accuracy and effectiveness, if provided with sufficient suitable point training data.
Fortunately, advances in remote sensing and mapping continue to provide us with more and better information on the global spatial distribution of many key (scorpan) environmental conditions. Climate data (c) is becoming increasingly detailed, accurate and available. Similarly, many currently available kinds of remotely sensed imagery provide increasingly useful proxies for describing spatial patterns of vegetation (o) and land use. Topography, or relief (r), is being described with increasing detail, precision and accuracy by ever finer resolution global digital elevation models (DEMs).
Unfortunately, several key environmental conditions are still not as well represented, by currently available environmental covariates, as one would wish. Improvements need to be made in acquiring global covariates that describe parent material (p), age (a) and spatial context or spatial position (n) better than they currently are. In addition, the scorpan model recognizes that available information about some aspect of the soil (s) can itself be used as a covariate in predicting some other (related) aspect of the soil. Only recently have we begun to see complete and consistent global maps of soil classes and soil properties emerge that can be used as covariates to represent the soil (s) factor in prediction models based on the scorpan concept.
Advances are being made in developing new covariates that provide improved proxies for describing parent material (p). Perhaps the best known of these, and the most directly relevant, is airborne gamma ray spectroscopy (Wilford, Bierwirth, and Craig 1997; Viscarra Rossel, Taylor, and McBratney 2007; Rouze, Morgan, and McBratney 2017). This sensor can provide very direct and interpretable information from which inferences can be made about both the mineralogy and the texture of the top few centimeters of the land surface. A number of countries (e.g. Australia, Uganda, Ireland) already possess complete, country-wide coverage of gamma ray spectroscopy surveys. More are likely to follow. Similarly, advances are being made in interpreting satellite based measurements of spatio-temporal variations in ground surface temperature and near surface soil moisture to infer properties of the parent material such as texture, and to a lesser extent, mineralogy (Liu et al. 2012). These act as very indirect proxies but they do help to distinguish warmer and more rapidly drying sands, for example, from colder and slower drying wet clays. Identifying and acquiring more detailed and more accurate covariates from which parent material type and texture can be inferred is a major ongoing challenge for which progress has been slow.
Only recently have a number of investigators begun to suggest a variety of covariates that can be calculated and used as proxies to describe spatial context or spatial position (n) in the scorpan model (T Behrens et al. 2018). These measures of spatial context or position can help to account for the effects of spatial autocorrelation in prediction models for many soil properties and attributes. They also help to coax out effects related to spatial context and spatial scale. The old adage that “what you see depends upon how closely you look” certainly applies to predictive soil mapping. If one only looks at the finest detail, one overlooks the broader context and broader patterns. Similarly, if one only looks at broad patterns (coarser resolutions) one can easily miss seeing, and predicting, important shorter range variation. Soils are known to form in response to a number of different soil forming processes and these processes are themselves known to operate over quite different ranges of process scales (or distances). So, if one looks only at the most detailed scales (e.g. finest spatial resolution) one can easily fail to observe, describe and account for important influences that operate across longer distances and larger scales. Increasingly, it is becoming evident that prediction models generate more accurate results when they incorporate consideration of a hierarchical pyramid of environmental covariates computed across a wide range of resolutions to represent a wide range of process scales and formative influences (T Behrens et al. 2018; Thorsten Behrens et al. 2018).
A final, and very significant, consideration, for environmental covariates is one of degree of availability and ease of use. For covariates to be effective, they must be relatively easy to identify, locate and use. Many existing spatial data sets need some form of preprocessing or transformation in order to become useful inputs as environmental covariates in predictive mapping. Difficulties and costs involved in locating, downloading and transforming these source data sets can severely restrict their effective use. Equally, many of these same covariates are often located, downloaded and processed multiple times by multiple entities for use in isolated projects and then archived (or disposed of) and not made easily available for subsequent use and reuse. A mentality of “protecting my data” leads to limitations on sharing and reuse of spatial data with large resulting costs from redoing the same work over and over for each new project. Significant improvements could be realized if spatial data sets, once assembled, corrected and preprocessed, could be widely shared and widely used.
In many PSM projects, as much as 80% of the time and effort expended can go into preparing and collating the environmental covariates used in the modelling process. If modelers could work collectively and collaboratively to share entire collections of relevant covariates at global to regional to national scales, considerable efficiencies could be realized. Time and effort now spent in assembling covariates could instead be devoted to locating and assembling more and better point O&M data and on discovering and applying improved models. So, one key way in which future inventory activities could be made much more efficient and cost-effective would be to develop mechanisms and platforms whereby comprehensive stacks of environmental covariates, covering entire regions of interest, could be jointly created, collated and freely shared. OpenGeoHub aims to provide a fully worked example of such a platform for sharing geodata.
9.3.6 Automated spatial prediction models (PSM)
Rapid adoption of new, automated, spatial prediction methods is the most fundamental change envisaged as being central to all efforts to redesign land resource inventories such that they can, once again, become affordable and feasible to conduct. These models are quantitative, objective, repeatable and updateable. They capture and codify understanding of how soils are arranged spatially in the landscape, and why, in ways that are systematic, rigorous and verifiable. Results of models can be updated regularly and easily, as new O&M point data, new covariates, or even new modelling algorithms become available. The time and costs associated with constructing prediction models is minimal in comparison with traditional manual mapping methods. Even more dramatically, once constructed, models can be rerun, against improved data, to update predictions regularly or to track changes in conditions through time.
Prediction models have changed, and improved, quite substantially, over the last few years. Most initial PSM models were linear (simple) and universal (applied equally to entire areas). Newer PSM models are increasingly non-linear and hierarchical with different mathematical combinations of predictors operating in different ways under different regional combinations of environmental conditions. More powerful methods involving Deep Learning and Artificial Intelligence have recently demonstrated improved prediction accuracies, compared to earlier, more simple, linear regression or tree models.
Automated prediction models have several other clear advantages over conventional manual mapping methods. Consider again, the previously discussed manual approaches of top-down versus bottom up mapping. Up until now, almost all previous manual (or indeed automated) mapping programs have been bottom up approaches applicable to bounded areas of some defined and limited extent such as individual farm fields, map sheets, counties, provinces, states or, at a maximum, entire countries. Any project that applies only to a bounded area of limited extent will, as a consequence, only collect, analyse and use observations and data that exist within the boundaries of the defined map extent.
Automated mapping methods have the advantage that they can be truly global. That is, they can use, and consider, all available point data, everywhere in the world, as evidence when constructing prediction rules. This means that all possible point data get used and no data go to waste. Global models, that use all available global point data are, in fact, an elegant and simple way of implementing the concept of Homosoil that has been advanced by Mallavan, Minasny, and McBratney (2010). The Homosol concept suggests that, if O&M data are not available for any particular point of interest in the world, then one should search to identify and locate a point somewhere else in the world that has the most similar possible combination of environmental conditions as the current unsampled point but that has also been sampled. Data for this sampled site are then used to characterize the current unsampled site. Global models simply reverse this search process by 180 degrees while at the same time making it much more efficient and simpler to implement. Global models take all available point data and then identify all other locations anywhere in the world that possess similar combinations of environmental conditions. All these similar locations are then assigned, via application of the prediction model, values for soil properties or soil classes that are similar to those observed at the sampled reference location, or multiple similar locations.
Global models not only make use of all available point data to develop rules, they also capture and quantify variation in soil classes and soil properties that operates over longer distances (10s to 100s of km) and coarser scales. This longer range variation is usually related to soil forming processes that themselves operate over longer distances, such as gradual, long distance variation in climate, vegetation or even topography (at the level of regional physiography). Long range variation may require consideration of patterns that express themselves over very large distances that may exist partially, or entirely, outside the boundaries of some current bounded area of interest. Local, bounded studies can easily fail to observe and quantify this long range variation.

Figure 9.1: General workflow of the spatial prediction system used to produce soil property and class maps via the LandGIS.
We can consider global models as providing a kind of elegant implementation of top down mapping (Fig. 9.1). Global models capture, describe and quantify that portion of the total spatial variation in soil properties and soil classes that occurs over longer distances in response to longer range soil forming processes. This longer range variation may only constitute some rather small percentage of the total range in local spatial variation in some property (typically some 10–30% of total variation). But it does represent a component of the total variation that would likely be missed, and not properly observed or accounted for, by local, bounded, models that do not consider patterns of spatial variation that extend outside their maximum boundaries or that occur entirely outside the boundaries of a contained study area.
In a top down mapping approach based on automated mapping, predictions made globally, using all globally available point data, can be used to account for longer range patterns of variation and can provide initial, a priori, estimates of the most likely values for soil properties or soil classes at a point. These initial, a priori, estimates can subsequently be updated and improved upon by more detailed local studies that have access to much larger volumes of local O&M point data. The values computed for soil properties by global models can be merged with values estimated by local models to create some form of merged weighted average. Alternately, the global estimates of soil property values can be used to represent soil type covariates (s) in a scorpan prediction model. Here, globally estimated property values are used as s-type covariates in predicting equivalent soil property values at local scales using local models.
Automated spatial prediction models also permit us to recognize that otherwise similar soils develop and express different properties under different types of human management. They don’t just permit this recognition, they force us to recognize differences in soils that arise from differences in land use. This is because automated prediction models are driven by the data that are fed to them and field O&M data collected from managed landscapes will invariably report different values for key soil properties than would be reported for otherwise similar soils under natural or unmanaged conditions. Thus, for automated predictive models to actually work, they have to observe and then predict differences in soils and soil properties between managed and natural landscapes. This was never something that was considered feasible to do with manual soil mapping. Consequently managed soils were usually named and mapped as if they were identical to their natural (unmanaged) equivalents. Differences might be described in reports or tables of laboratory analyses, but the two variations of the same soil (managed and natural) were rarely, if ever, mapped as separately described entities.
In a similar way, automated prediction methods force us to recognize and account for temporal variations that arise from changes in soil conditions or soil attributes at the same locations over time. The models will predict values similar to those provided to them as input from field observations and measurements. If we have point O&M data for the same point location that is separated in time and that reflects changes in soil property values through time, we need to be able to recognize this and adapt to it. We need to recognize that all predictions apply to a specific time period and that different predictions (maps) need to be produced for different time periods, if the available point O&M data reference widely different time periods.
In the context of automated mapping and High Performance Computing, opportunities for producing high quality soil maps using Open Source software are becoming more and more attractive. However, not all Open Source Machine Learning packages are equally applicable for processing large national or international data sets at resolutions of 250 m or better. LandGIS predictions are, for example, possible only thanks to the following packages that can be fully parallelized and are ready for upscaling predictions (all written in C++ in fact):
ranger (https://github.com/imbs-hl/ranger),
xgboost (https://xgboost.readthedocs.io/en/latest/),
liquidSVM (https://github.com/liquidSVM/liquidSVM),
these can be further efficiently combined with accuracy assessment and fine-tuning packages (also ready for parallelization):
SuperLearner (https://cran.r-project.org/web/packages/SuperLearner/),
caret (https://topepo.github.io/caret/),
mlr (https://mlr.mlr-org.com/),
Beyond that it is not trivial to use R for production of large rasters where millions of points with hundreds of covariates are used for model building. So it is important to realize that Open Source does not have out-of-box solutions for PSM projects, but requires active involvement and development.
9.3.7 Hosting, publishing, sharing and using spatial data
Finally, we need to consider how future inventory activities can benefit from improved approaches for hosting, publishing, sharing and using spatial data, with special attention paid to predictions of soil properties or soil classes.
The value of data is in its use. Thus, we only get full value for our data if we can maximize its distribution and use. Developments in mechanisms and communities for sharing digital data online provide promise of greatly improved access to, and use of, new digital data sets, including predictive soil maps. Major developments in hosting and delivering spatial data online include new and increased interest in, and adherence to, principles of FAIR Data, FAST Data and, most importantly, OPEN Data.
FAIR Data principles aim to make data findable, accessible, interoperable and reusable (Wilkinson et al. 2016). The easier data are to locate and access, the greater the use is likely to be. Similarly, data that are interoperable are easier to ingest into end user applications, and so, will receive greater use. Data that are reusable also ensure maximum benefit by facilitating regular use and reuse.
FAST data is the application of big data analytics to smaller data sets in near-real or real-time in order to solve a problem or create business value. The goal of fast data is to quickly gather and mine structured and unstructured data so that action can be taken (https://whatis.techtarget.com/definition/fast-data). Fast data is fundamentally different from Big Data in many ways. Big Data is most typically data at rest, hundreds of terabytes or even petabytes of it, taking up lots of space on disk drives. Fast data is data in motion (https://www.voltdb.com/why-voltdb/big-data/). OpenGeoHub aims to use Big Data analytics to rapidly and affordably turn static and unstructured data into easily used, and widely used information. The objective should be to rapidly generate agile, flexible and user oriented data.
Future soil inventory projects based on application of predictive soil modelling will also benefit from adopting the following principles of OPEN Data based on the Sunlight Foundation’s “Ten Principles for Opening up Government Information” (https://open.canada.ca/en/open-data-principles#toc95):
1. Completeness
Data sets should be as complete as possible, reflecting the entirety of
what is recorded about a particular subject. All raw information from a
data set should be released to the public, unless there are Access to
Information or Privacy issues. Metadata that defines and explains the
raw data should be included, along with explanations for how the data
was calculated.
2. Primacy
Data sets should come from a primary source. This includes the original
information collected by the original sources and available details on
how the data was collected. Public dissemination will allow users to
verify that information was collected properly and recorded accurately.
3. Timeliness
Data sets released should be made available to the public in a timely
fashion. Whenever feasible, information collected by original entities
should be released as quickly as it is gathered and collected. Priority
should be given to data whose utility is time sensitive.
4. Ease of Physical and Electronic Access
Data sets released by their producers should be as accessible as
possible, with accessibility defined as the ease with which information
can be obtained. Barriers to electronic access include making data
accessible only via submitted forms or systems that require
browser-oriented technologies (e.g., Flash, Javascript, cookies or Java
applets). By contrast, providing an interface for users to make specific
calls for data through an Application Programming Interface (API) make
data much more readily accessible.
5. Machine readability
Machines can handle certain kinds of inputs much better than others.
Data sets should be released in widely-used file formats that easily lend
themselves to machine processing (e.g. CSV, XML). These files should be
accompanied by documentation related to the format and how to use it in
relation to the data.
6. Non-discrimination
Non-discrimination refers to who can access data and how they must do
so. Barriers to use of data can include registration or membership
requirements. Released data sets should have as few barriers to use as
possible. Non-discriminatory access to data should enable any person to
access the data at any time without having to identify him/herself or
provide any justification for doing so.
7. Use of Commonly Owned Standards
Commonly owned standards refer to who owns the format in which data is
stored. For example, if only one company manufactures the program that
can read a file where data is stored, access to that information is
dependent upon use of that company’s program. Sometimes that program is
unavailable to the public at any cost, or is available, but for a fee.
Removing this cost makes the data available to a wider pool of potential
users. Released data sets should be in freely available file formats as
often as possible.
8. Licencing
All data sets should be released under a recognized Open Data Licence.
Such licences are designed to increase openness and minimize
restrictions on the use of the data.
9. Permanence
The capability of finding information over time is referred to as
permanence. For best use by the public, information made available
online should remain online, with appropriate version-tracking and
archiving over time.
10. Usage Costs
All open data should be provided free of charge.
A preferred way of achieving FAIR, FAST and OPEN data distribution is to develop and maintain new, online platforms that support collaborative compilation, sharing and geopublishing. OpenGeoHub aims to provide a viable, worked example of how a new, open and collaborative web-based platform can deliver soil spatial information on-demand and in nearly real time.
9.3.8 New visualization and data analysis tools
Terrestrial resource inventories, and indeed spatial inventories of almost all environmental conditions, will increasingly benefit from adopting and using new tools and platforms that enhance interactive, real time data visualization and data analysis.
Spatial data increasingly needs to be presented in ways that support interactive, real time visualization of 3 dimensions plus time. What is increasingly being referred to as 4D or 3D+ time. We need to help users visualize, and appreciate, how soils vary with depth as well as in horizontal space. And, also increasingly, we need to be able to help users visualize and understand how soils can vary through time. OpenGeoHub is attempting to demonstrate newly available facilities for visualizing, and interacting with, 3D and 3D+ time spatio-temporal data.
Every effort needs to be made to facilitate easy use of terrestrial resource inventory spatial data. This should entail releasing spatial data that has both the content and the format required for immediate ingestion into, and use in, critical end user applications. Users should be able to link their applications to data supplier platforms and simple call up needed data.
9.4 The future of PSM: Embracing new organizational and governance models
9.4.1 Overview
In the same way that new scientific and technological advances can be embraced to improve future PSM any new, future, PSM activities should also take advantage of newer organizational models that improve how collective activities can be organized and managed collaboratively and cooperatively through innovations such as (Hengl, Wheeler, and MacMillan 2018):
Open data and platforms and procedures for acquiring and sharing data,
Open, cloud-based, processing capabilities,
Collaborative production of inputs and new outputs,
Crowdsourcing and voluntary collaboration,
Crowdfunding and blockchain funding systems,
Web-based sponsorship and revenue opportunities,
9.4.2 Open data and platforms and procedures for acquiring and sharing it
Open data is, of course, the key requirement for enabling maximum access to, and use of, point and covariate data required to support collaborative PSM. Firewalls, paywalls and data silos typically act to restrict access to, and use of, valuable point and covariate data, Open data can be used and reused, multiple times, often for unanticipated applications. Data need to be not only open but also easily discoverable and accessible. This is where open platforms, such as OpenGeoHub, come in. They can facilitate easy and effective access to, and use of, shared open data.
9.4.3 Open cloud-based processing capabilities
At the moment, most PSM activities take place on local computers using local processors. As PSM proceeds and increasingly deals with much larger data sets at much finer spatial resolutions, it may become less and less viable to download all data for local processing. Imagine trying to download 5 to 10 m resolution raster data for an entire continent, or even the entire world, for tens to perhaps hundreds of layers of covariate data. We may rapidly arrive at a situation where it could take months to years to simply download such large volumes of data before any analyses could take place. It such a situation, it no longer makes sense to try to download covariate data sets to work with them locally.
Similarly, many big data applications have now accepted that it is far more efficient and affordable to conduct their processing and analysis in the cloud using services such as Amazon cloud services, Google Earth Engine or Microsoft cloud services. It has become too costly to assemble and maintain the massive amounts of processing power, and memory, in house that are increasingly required to process massive data sets using big data analytics.
Modelers can easily obtain and download all available covariate data for all point locations for which they possess point observations or measurements. Typically, entire stacks of covariate data can be identified and downloaded for thousands of point locations within just a few seconds of submitting a query. This covariate data is all that is needed to create the matrices required to support development, evaluation and finalization of multiple predictive models for PSM. Once an optimum model (or models) has been developed, the model itself can be uploaded to a cloud based processing service and the model can be run against all covariate data stored in the cloud, using cloud based memory and processing capabilities. This is perhaps a preferable and more practical way to implement PSM modelling for very large data sets.
9.4.4 Collaborative production of inputs and new outputs
It is likely that it will increasingly only be possible to produce next generation national to state level PSM inventory products through some form of collaborative effort. It is very unusual for any one agency or entity to have both the mandate and the resources to assume responsibility for producing maps for entire countries or even entire provinces or states. Mapping and field data collection activities tend to be fragmented in response to various jurisdictional mandates and operational responsibilities. Agricultural departments are responsible for agricultural lands, forestry for forested areas, parks departments for public parklands and environmental departments for conservation areas. No one entity ever seems to have responsibility for mapping an entire country or state. In addition, a majority of mapping and field data collection programs are now typically undertaken by private engineering and environmental consulting companies on contract to industry or government clients. The people charged with collecting the field data seldom have any responsibility or mandate for ongoing custodianship and preservation of the collected data. The companies or government agencies that contracted to have the data collected themselves typically lack the resources, expertise or motivation to conserve and maintain the field data delivered to them, let alone to share it widely with others.
So, how can a situation be achieved where a large proportion of point data collected in the field, or analysed in a lab, are collated, stored and maintained for widespread distribution, use and reuse in PSM? We believe that what is required are both physical (or virtual) platforms where collaboration and sharing can be facilitated and legal and organisational protocols that encourage, and indeed require, saving, maintaining and sharing of point observation data collectively and collaboratively.
What is required is a change in attitude that is reflected by equivalent changes in regulations and procedures. Governments and private sector industries that require, or commission, field data collection activities need to adopt procedures and rules that require any new data to be deposited in an open repository where it can be widely and easily accessed and shared. Similarly, laboratories that undertake analysis of field collected samples need to be encouraged, or even obliged, to submit analytical results for samples from point locations to some shared and open repository. If this were to occur, then anyone interested in producing maps for any area would have access to all potentially available and useful point data to inform and drive their predictive models. We offer OpenGeoHub as an example of a physical platform where all of point data, covariate data and output predictive maps can be widely and freely published, archived and shared.
The production of output maps can also be undertaken as a collective and collaborative exercise. Individuals and agencies can work together to create and share input data sets (point data and covariates) and models and to jointly produce maps for areas of common interest. The more people that get involved in producing new maps using common, open databases, the greater the number, variety and utility of maps we are likely to see produced.
9.4.5 Crowdsourcing and voluntary collaboration,
There is a role in PSM for crowdsourcing and voluntary contributions from citizen scientists (Hengl, Wheeler, and MacMillan 2018). Sampling plans can be developed and volunteers can be encouraged to go to identified sampling locations to collect a series of easy to make observations using a provided template. One active example of this approach is the Degree Confluence Project. This project aims to have people visit each of the exact integer degree intersections of latitude and longitude on Earth, posting photographs and a narrative of each visit online (https://en.wikipedia.org/wiki/Degree_Confluence_Project). The project describes itself as “an organized sampling of the world” and is purely based on enthusiasm.
Monitoring programs can vary significantly, ranging from community based monitoring on a local scale, to large-scale collaborative global monitoring programs such as those focused on climate change (Lovett et al. 2007). There is a global recognition that “environmental issues are best handled with the participation of all concerned citizens”, a principal first articulated in the United Nation’s Earth Summit Agenda 21 (UN, 1992). This principle was strengthened further in July, 2009, with the formal ratification of the Aarhus Convention which mandates participation by the public in environmental decision-making and access to justice in environmental matters (UNECE, 2008).
If volunteers can be advised where to go and what to observe, or collect, at sample locations following a defined format or template, much useful data can be collected for use in PSM. For example, it is relatively easy to make very useful field observations about whether a location is a wetland organic soil or an upland mineral soil. This, in itself, is very useful to know. Similarly, citizen scientists can be instructed to obtain valuable measurements such as depth of a soil to bedrock, thickness of a topsoil horizon, color of a topsoil or subsoil horizon or presence or absence of bare rock, water, stones or gullies. It is even possible to provide detailed instructions that permit volunteers to estimate soil texture by application of manual hand texture assessments. Increasingly, apps are likely to be developed for mobile phones that will support quantitative assessments of soil color or structure and, possibly very soon, spectroscopic analysis of soil properties on-site. So, future PSM activities should look for opportunities to engage citizen volunteers in collecting field observations and measurements to extend what PSM is able to accomplish now using data collected data by professionals.
9.4.6 Sponsorship, subscription, crowdfunding and blockchain funding systems
Someone has to pay to finance the collection of new field and laboratory point data, the assembly, storage and distribution of databases of relevant point data or environmental covariates at relevant resolutions and the production, publication, maintenance and distribution of any models, output maps or other end products. We can imagine several possible revenue streams that could be adopted to fund a collaborative platform in a sustainable way. These include:
Sponsorship,
Subscriptions by participating partners,
Crowdfunding,
Blockchain funding,
Advertising revenue,
Sponsors are those who provide funds willingly to support operations and activities that they consider to be beneficial, possibly to themselves but, more importantly, to wider society. Sponsors typically regard the services and products provided by the funded entity as delivering a desirable public good or public service and to therefore be worthy of their financial support. Sponsors typically do not dictate what gets done, or how, but sponsors do have some expectations that their funding will ensure that the public good activities they support will continue to be undertaken and delivered by the funding recipient in a consistent and responsible manner.
We can imagine that an open collaborative for natural resource inventory products might attract sponsorship from philanthropic donors who elect to fund environmental activities undertaken in support of the broader public interest. Some government agencies, or even commercial companies, might also elect to offer ongoing sponsorship funding. The main role of sponsorship funding ought to be to provide some minimum base level of income that can pay for the ongoing costs associated with maintaining basic operational capabilities. Examples of basic operational costs include ongoing charges for paying for website development and maintenance, online storage, web traffic and web based processing arising from user activity and system administration. These are basically just the costs associated with keeping the lights on and the doors open. They ensure continuity from year to year but do not usually fund major expansions or annual production activities.
Active contributors to, and users of, the products and services generated by a consortium or collective of partners can help to self-fund the collective’s activities by agreeing to contribute funds via some sort of continuing subscription. Partners may be able to justify paying an annual subscription to sustain the collective activity because they, themselves, obtain benefits or reduce internal expenditures they would otherwise normally pay for the same sets of services or activities internally and individually. Sharing platforms for collecting, creating, hosting, publishing and disseminating spatial environmental data could be more cost effective than building and maintaining multiple separate platforms and functionalities individually (Fig. 9.2). These reduced, or avoided, costs could justify contributing some funds to pay for, and sustain, the operations of the collective. Sustaining subscriptions are a more stable and reliable way to fund the ongoing development and maintenance of the collective’s activities and infrastructure because they can be more reliably estimated and counted on. These funds can also help pay for new work and new data.
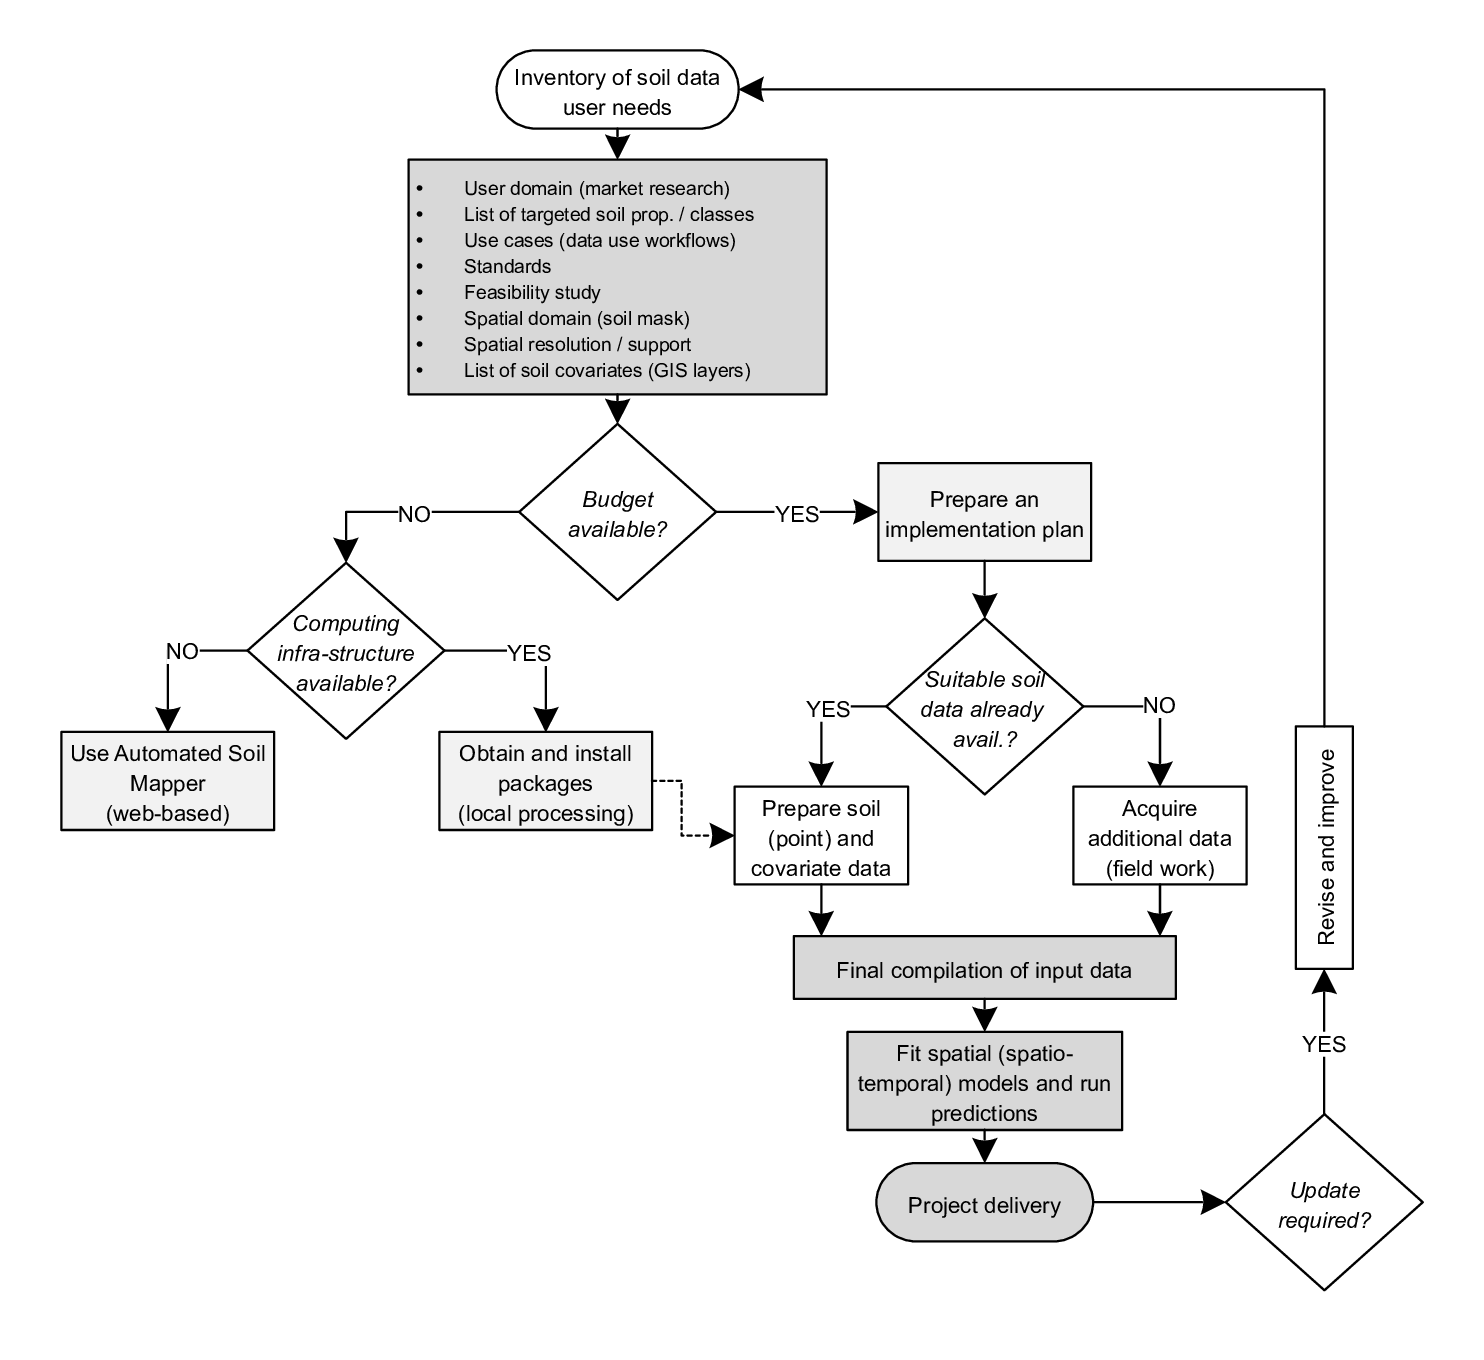
Figure 9.2: Recommended decision tree for designing a PSM project. In essence, users’ perspective and technical settings should be the key for most of decisions when it comes to design of PSM projects.
One can imagine quite a large number of potential partners, that might be willing to agree to contributing an annual sustaining subscription. Examples of the kinds of partners that might subscribe include:
Government agencies with a mandate or need to produce or use environmental data,
Industrial and commercial companies that have responsibilities for submitting environmental data,
Engineering and environmental consulting companies that are typically paid to collect environmental data and produce maps,
NGOs and public interest groups that advocate for sustainability or environmental protection,
Universities and research institutions with interests in teaching or conducting environmental research,
Industry associations and professional certification bodies,
Commercial companies that provide products or services in the areas of computing, spatial analysis and the environment.
One would expect that partners willing to contribute a sustaining subscription would have something to gain from being active participants. They might contribute actively to adding to the collections of field data or new maps produced or distributed by themselves or by the collective. They might find it convenient and effective to use the platforms and infrastructure maintained by the collective to assist them to not only produce new data but to publish and disseminate, widely and effectively, any new data or maps they might produce. Producers of new maps and data would have their capabilities and products highlighted and gain from exposure and credibility. High volume users of data would gain from savings realized by having a single, one-stop platform for finding and obtaining data they need and from the security they would feel in using credible data produced using transparent processes in full public view. Universities and research institutions would gain from having access to the latest and most complete data and methods and to new facilities and new approaches to expose their students to. And commercial companies that provide software, hardware or services to the environmental community can gain by being associated with providing support for an entity that is providing high quality information as a public good.
Crowdfunding is becoming an increasingly common way to secure money to conduct, and sustain, public good activities. Users who benefit from accessing the site and using free data may well be motivated to offer their support in the form of voluntary donations. Donors can be acknowledged and thanked on the site by maintaining a web page that lists voluntary contributions.
It is becoming increasingly common for sites that offer free data or services to sustain themselves by accepting revenue from advertisers that want to be associated with the product or services provided by the site or just want to benefit from the exposure gained from high volumes of traffic to the site.
9.4.7 A proposal for organizing and managing a new open collective
So, what is it that we would like to promote and implement as we proceed into the future? The basic concept is to imagine, design and build a new, collaborative and cooperative framework for collecting, analyzing, maintaining, producing and distributing spatial information about attributes and classes of terrestrial landscapes. The idea may be thought of as a virtual network for creating and supporting ongoing, comprehensive terrestrial resource inventories of all kinds and their required supporting infrastructures. The concept adopts, and extends, many of the elements of the existing Global Soil Information Facilities (GSIF) (http://www.isric.org/content/soilgrids), and of the recently launched OpenGeoHub Foundation’s LandGIS (http://landgis.opengeohub.org).
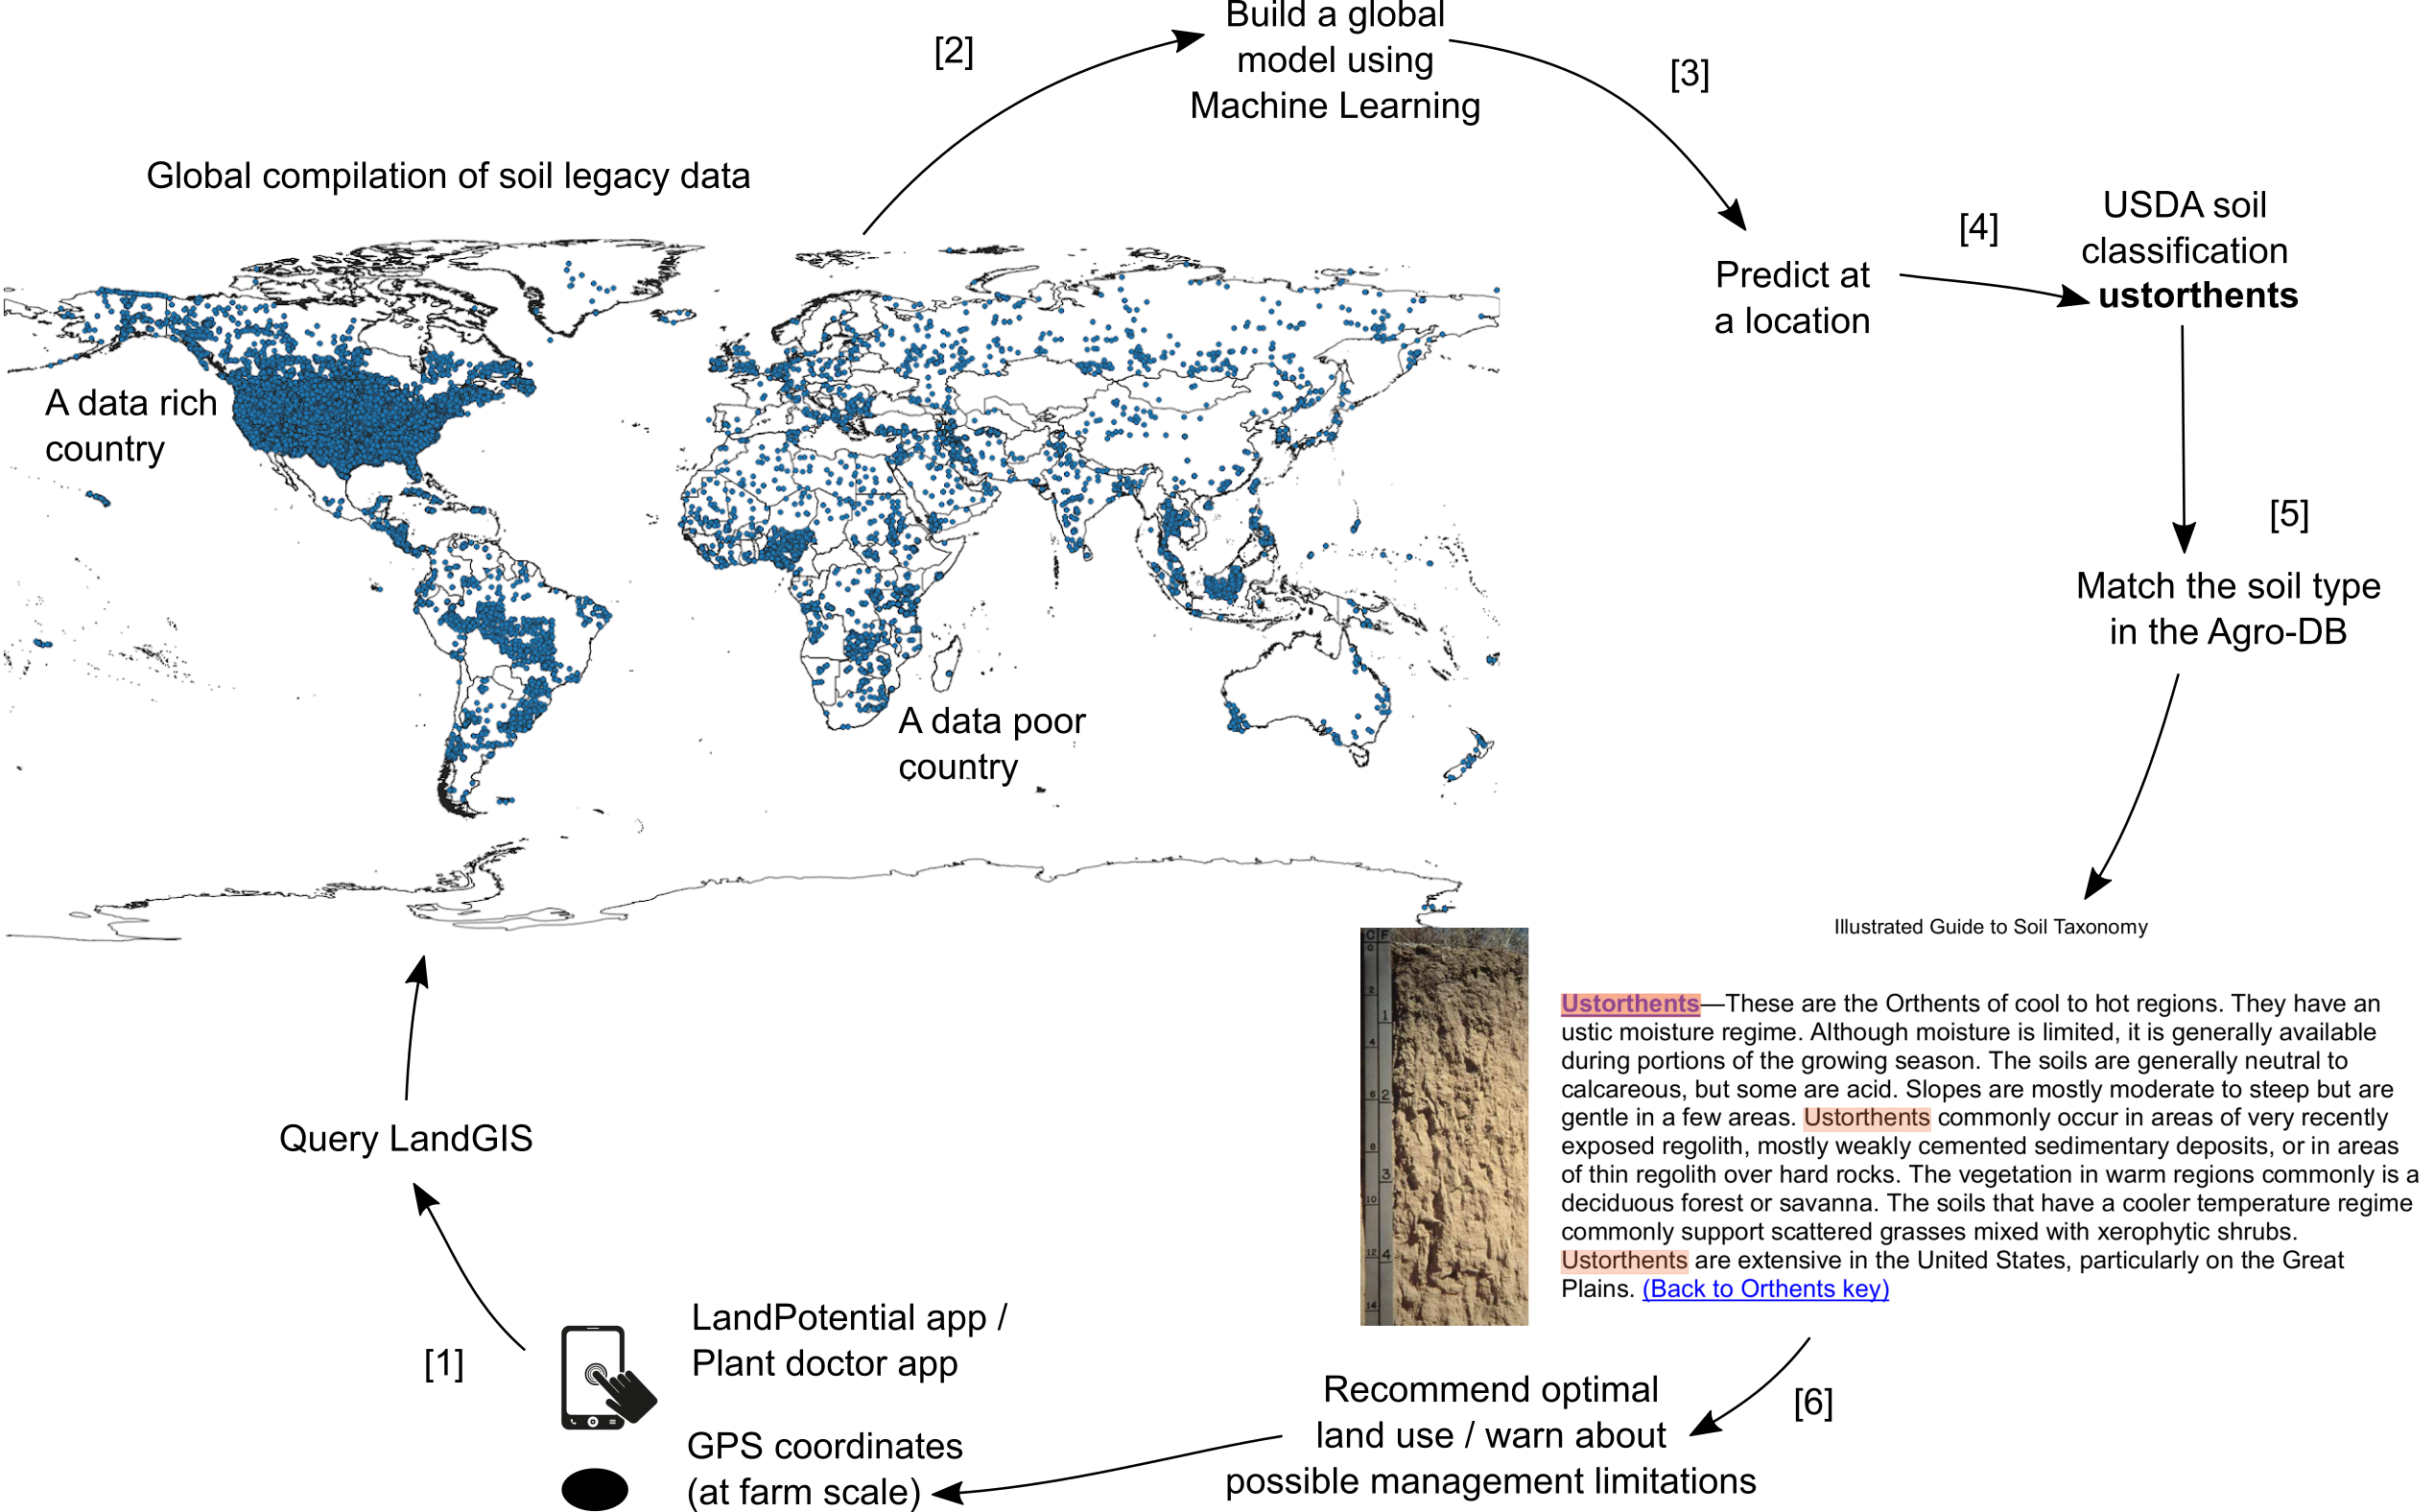
Figure 9.3: LandGIS as a system for generating new added-value information immediately and affordably using “old legacy data” i.e. without new investments. By importing, cleaning up and data mining of legacy soil data we promote technology and knowledge transfer from data-rich countries to data-poor countries.
We imagine harnessing the possibilities for collective and cooperative action offered by new and emerging methods for social networking and scientific cooperation (Fig. 9.3). The concept aims to promote, incorporate and make use of all relevant new scientific and technical advances in the assembly and processing of terrestrial spatial data. But the vision is not solely driven by technology push from new scientific and technical methods. Rather, it is primarily driven by recognition of the power inherent in emerging trends in crowd-sourcing and facilitated collective action.
Companies, such as Dupont, advertise that they are part of a global collaboratory, and recognize that their businesses, and profit, benefit greatly from sharing much of their proprietary internal research data with partners and even competitors. This recognizes the fact that many agencies and companies are in the business of collecting and analyzing data to try to extract useful knowledge or information from that data. The larger and more comprehensive the pool of data, the more likely it is to yield new and valuable understandings or knowledge and then, from this, enable the creation of new and useful, or profitable, products.
Automatically creating maps of the spatial distribution of terrestrial spatial entities, or their attributes, represents one particular application of data mining techniques for extracting understanding and knowledge from data to produce new and useful products. We propose that by cooperating to maximize the assembly and sharing of data about terrestrial entities, using best available methods, we can expect to also maximize the knowledge, the information and the variety, quality and value of new products that can be extracted from the assembled data. Our LandGIS is now a proof of concept of an Open Data system where any group can contribute and use as a publishing platform. We anticipate that our LandGIS will be further combined with data channels produced by other groups, e.g. the landpotential.org project or similar, so that a top-down, bottom-up (predictions based on global models combined with local verification and adjustments; Fig. 7.2), can be realized.
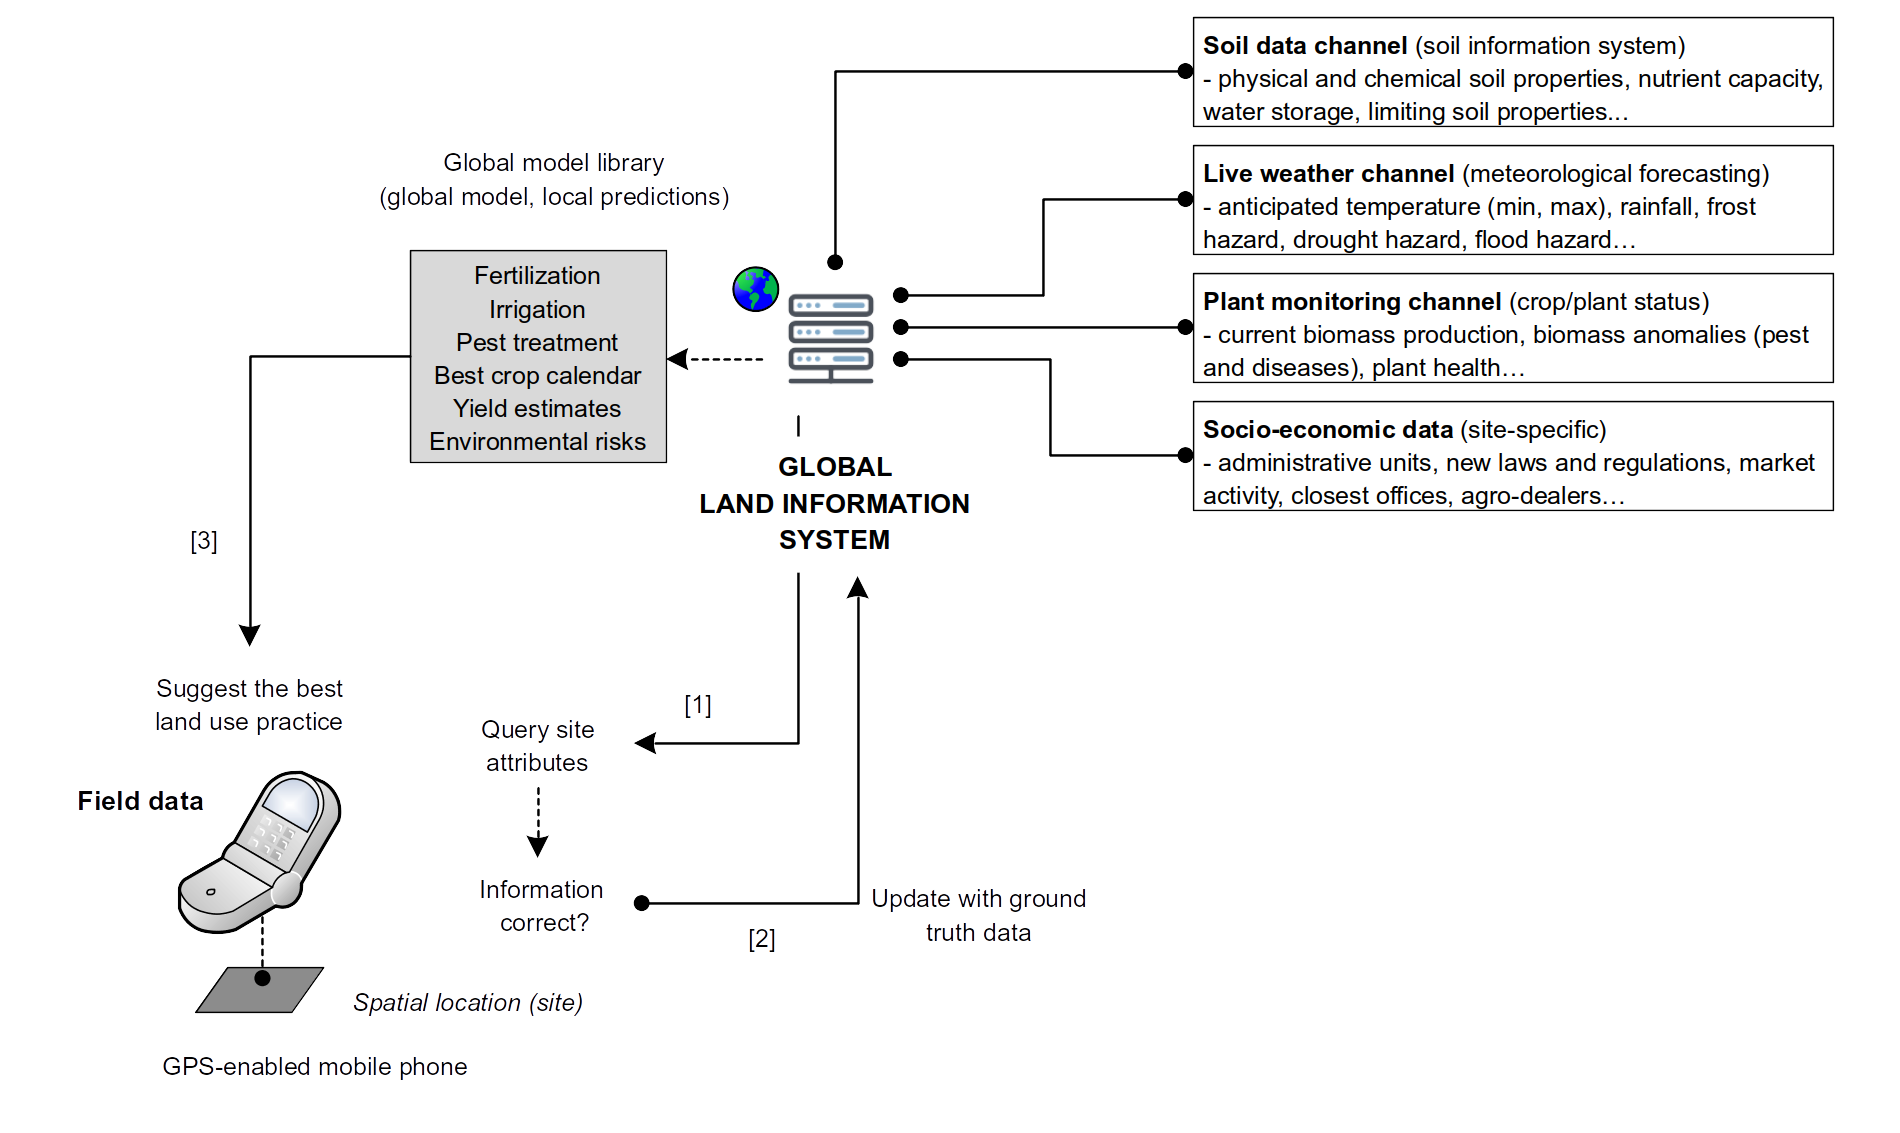
Figure 9.4: The proposed Global Land Information System (built on the top of the LandGIS concept) and targeted functionality: users on ground send local observations and measurements through their mobile phones, which are then used to run and re-callibrate global models.
There are probably many viable ways in which a collective could be set up to organize and manage the various collaborative activities required to implement a new virtual terrestrial resource inventory entity. Many are likely to be attracted to the idea of setting up a semi-independent institute affiliated with a university or research institute. For example, for many years, soil survey activities in Canadian provinces, such as Alberta, were conducted officially under the auspices of Institutes of Pedology that formalized cooperation among federal and provincial government departments and university departments of soil science. Others might be attracted to the idea of spinning off a notionally independent private sector company within which other entities could collaborate to produce or distribute their data. Examples of private companies involved in distributing spatial data include AltaLIS (https://beta.altalis.com) and Valtis (http://www.valtus.com) which operate in Alberta.
We, quite understandably, favor an approach of creating a small, agile, not-for-profit foundation that can act as a core entity for a larger network of partners and collaborators. The foundation can provide essential back office types of support as well as shared infrastructure that supports and facilitates all technical facets of the collection, assembly, production, publishing, dissemination and use of spatial environmental data.
This is the concept behind the newly formed OpenGeoHub Foundation (https://opengeohub.org). We see OpenGeoHub as an entity that can build, operate and maintain a core set of functionalities and infrastructure required to support a wide variety of inventory type activities. This core functionality can provide back office facilities and support that can be made use of by any entity that desires to be actively involved in the collection, production or distribution of spatial environmental information. Just as many companies and agencies have increasingly begun to outsource their data storage, data processing and even key functions such as payroll and human resources, so too could entities involved in the production or use or spatial data outsource many of their functions to OpenGeoHub. It is expensive and time consuming to build and maintain custom functionality in house to support the production and distribution of inventory spatial data. Why not build it well once and make this functionality available to everyone? If some desired functionality is missing, then build it inside the foundation so that all can benefit from using the new functionality. Why spend money and time building multiple versions of systems with equivalent functionality and purpose when one will do for all? Then the partner entities can concentrate on doing what their mandates instruct them to do, and not on building and maintaining separate spatial analysis and spatial distribution systems and infrastructures.
We would hope that OpenGeoHub can act as a fully functional, worked example of how collaboration and collective action in the area of production and delivery of environmental spatial data could be organized and implemented efficiently and effectively. Once the concept has been demonstrated and accepted, it might well prove useful to replicate or clone the concept, including all of its functionalities, for use at national, state or regional levels. As with any other concept that works, cloning to set up franchise operations is widely accepted. It is not necessary to reinvent the wheel to set up a cloned franchise operation. Most of the design and functionality can simply be replicated for use at the local franchise level. We envisage OpenGeoHub as a test case and an incubator that, if successful, could form a template for many other successful spin-offs.
References
Arrouays, Dominique, Johan GB Leenaars, Anne C Richer-de-Forges, Kabindra Adhikari, Cristiano Ballabio, Mogens Greve, Mike Grundy, et al. 2017. “Soil legacy data rescue via GlobalSoilMap and other international and national initiatives.” GeoResJ 14. Elsevier:1–19.
Brown, J.A., B.L. Robertson, and T. McDonald. 2015. “Spatially Balanced Sampling: Application to Environmental Surveys.” Procedia Environmental Sciences 27. Elsevier:6–9.
Stumpf, Felix, Karsten Schmidt, Philipp Goebes, Thorsten Behrens, Sarah Schönbrodt-Stitt, Alexandre Wadoux, Wei Xiang, and Thomas Scholten. 2017. “Uncertainty-Guided Sampling to Improve Digital Soil Maps.” Catena 153. Elsevier:30–38.
Brus, D.J. 2019. “Sampling for digital soil mapping: A tutorial supported by R scripts.” Geoderma 338:464–80. https://doi.org/10.1016/j.geoderma.2018.07.036.
Malone, Brendan P., Budiman Minansy, and Colby Brungard. 2019. “Some Methods to Improve the Utility of Conditioned Latin Hypercube Sampling.” PeerJ 7 (February):e6451. https://doi.org/10.7717/peerj.6451.
Stumpf, Felix, Karsten Schmidt, Thorsten Behrens, Sarah Schönbrodt-Stitt, Giovanni Buzzo, Christian Dumperth, Alexandre Wadoux, Wei Xiang, and Thomas Scholten. 2016. “Incorporating Limited Field Operability and Legacy Soil Samples in a Hypercube Sampling Design for Digital Soil Mapping.” Journal of Plant Nutrition and Soil Science 179 (4). Wiley Online Library:499–509.
Gerber, Rolf, Peter Felix-Henningsen, Thorsten Behrens, and Thomas Scholten. 2010. “Applicability of Ground-Penetrating Radar as a Tool for Nondestructive Soil-Depth Mapping on Pleistocene Periglacial Slope Deposits.” Journal of Plant Nutrition and Soil Science 173 (2). Wiley Online Library:173–84.
Rouze, GS, CLS Morgan, and AB McBratney. 2017. “Understanding the Utility of Aerial Gamma Radiometrics for Mapping Soil Properties Through Proximal Gamma Surveys.” Geoderma 289. Elsevier:185–95.
Hutengs, Christopher, Bernard Ludwig, András Jung, Andreas Eisele, and Michael Vohland. 2018. “Comparison of Portable and Bench-Top Spectrometers for Mid-Infrared Diffuse Reflectance Measurements of Soils.” Sensors 18 (4). https://doi.org/10.3390/s18040993.
Shepherd, Keith D., and Markus G. Walsh. 2002. “Development of Reflectance Spectral Libraries for Characterization of Soil Properties.” Soil Science Society of America Journal 66 (3). Soil Science Society:988–98.
Shepherd, K.D., and M.G. Walsh. 2007. “Infrared Spectroscopy — Enabling an Evidence Based Diagnostic Survellance Approach to Agricultural and Environmental Management in Developing Countries.” Journal of Near Infrared Spectroscopy 15:1–19.
Rossel, RA Viscarra, T Behrens, E Ben-Dor, DJ Brown, JAM Demattê, Keith D Shepherd, Z Shi, B Stenberg, A Stevens, and Vj Adamchuk. 2016. “A Global Spectral Library to Characterize the World’s Soil.” Earth-Science Reviews 155:198–230. https://doi.org/10.1016/j.earscirev.2016.01.012.
Wilford, JR, PN Bierwirth, and MA Craig. 1997. “Application of Airborne Gamma-Ray Spectrometry in Soil/Regolith Mapping and Applied Geomorphology.” AGSO Journal of Australian Geology and Geophysics 17 (2):201–16.
Viscarra Rossel, RA, HJ Taylor, and AB McBratney. 2007. “Multivariate Calibration of Hyperspectral Gamma-Ray Energy Spectra for Proximal Soil Sensing.” European Journal of Soil Science 58 (1). Wiley Online Library:343–53.
Liu, Feng, Xiaoyuan Geng, A-Xing Zhu, Walter Fraser, and Arnie Waddell. 2012. “Soil texture mapping over low relief areas using land surface feedback dynamic patterns extracted from MODIS.” Geoderma 171. Elsevier:44–52.
Behrens, T, K Schmidt, RA Viscarra Rossel, P Gries, T Scholten, and RA MacMillan. 2018. “Spatial modelling with Euclidean distance fields and machine learning.” European Journal of Soil Science 69 (5). Wiley Online Library:757–70.
Behrens, Thorsten, Karsten Schmidt, Robert A MacMillan, and Raphael A Viscarra Rossel. 2018. “Multi-Scale Digital Soil Mapping with Deep Learning.” Scientific Reports 8 (October). Nature Publishing Group:15244. https://doi.org/10.1038/s41598-018-33516-6.
Mallavan, B.P., B. Minasny, and A. B. McBratney. 2010. “Homosoil, a Methodology for Quantitative Extrapolation of Soil Information Across the Globe.” In Digital Soil Mapping, edited by J. L. Boettinger, 2:137–49. Progress in Soil Science. Elsevier; Elsevier. https://doi.org/10.1007/978-90-481-8863-5_12.
Wilkinson, Mark D, Michel Dumontier, IJsbrand Jan Aalbersberg, Gabrielle Appleton, Myles Axton, Arie Baak, Niklas Blomberg, et al. 2016. “The FAIR Guiding Principles for scientific data management and stewardship.” Scientific Data 3. Nature Publishing Group.
Hengl, Tomislav, Ichsani Wheeler, and Robert A MacMillan. 2018. “A brief introduction to Open Data, Open Source Software and Collective Intelligence for environmental data creators and users.” PeerJ Preprints 6 (October):e27127v2. https://doi.org/10.7287/peerj.preprints.27127v2.
Lovett, Gary M, Douglas A Burns, Charles T Driscoll, Jennifer C Jenkins, Myron J Mitchell, Lindsey Rustad, James B Shanley, Gene E Likens, and Richard Haeuber. 2007. “Who Needs Environmental Monitoring?” Frontiers in Ecology and the Environment 5 (5). Wiley Online Library:253–60.